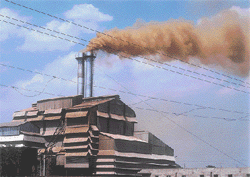
Chimney sweepers
Chimney sweepers

Cse' s study to estimate industrial pollution is based on a model called the Industrial Pollution Projection System ( ipps ), developed by the World Bank ( wb) . The wb had earlier used the same model to estimate the pollution load in countries such as Indonesia and the Philippines for the 1975-88 period. cse used the same model to estimate India's pollution load for 1975 to 1995.Besides the fact that industrial pollution quadrupled in 20 years, the study concluded that:
- Among the six pollutants, heavy metal pollution registered a four-fold increase, followed closely by sulphur dioxide ( so 2 ) and particulates (see chart: Chimney smoking );
- Chemicals, rubber, textiles, iron and steel, non-metal products, food products (because of the sheer size of the industry), paper, printing and publishing are some of the top polluting industries;
- In 1988, the industrial pollution load in India was six times higher than that in Indonesia and almost eight times higher than in the Philippines (see box: Carrying the load ).
In the 50 years of independence, many small towns have also registered a phenomenal industrial growth. The textile industry is taking its toll in Tiruppur, Tamil Nadu, while Kanpur in Uttar Pradesh is falling prey to the wastes from the tannery industry. In Bokaro, there is more than a "little bit of steel' in everybody's life (see box: Bokaro ). And Asia's so-called largest chemical zone in Gujarat is an amalgam of hazardous industries at close quarters, not only making the air a cocktail of different gases but also filtering the metals into the soil and water (see box: Lethal overdose ).
A simple approach
The cse study to quantify the extent of industrial pollution is perhaps the first such study carried out in India. The wb model, on which the cse estimates were based, differentiates air and water pollutants into six categories: linear toxicity (an average of 312 toxic emissions from industries), heavy metals (an average of different heavy metal emissions from industries), biological oxygen demand ( bod ), sulphur dioxide, particulate matter and suspended solids. The total pollution is estimated as a combination of these six pollutants.
The wb model uses two sets of data. Firstly, it takes into account production in the 21 industrial sectors listed under the International Standard of Industrial Classification for the year 1975 to 1995. For India, the data were obtained from the Annual Survey of Industries reports.
Secondly, the model takes into account the amount of six pollutants emitted in the us from each of the 21 industries in 1988 per us $1 million worth of production. In addition to the above data, Indian price indices and us exchange rates for the relevant years were used for calculating the pollution load.
As there is no systematic database on pollution from industrial activities in India, the cse study made an assumption that technology in India is the same as the 1988 us technology of production. Such an assumption will lead mostly to conservative estimates as the technology used in the us industries is on average cleaner than India.
Moreover, the cse model only takes into account pollution at the production stage. But industries pollute at every stage of the life cycle of their product


