

Caught in a trap
Caught in a trap
50 per cent of the people in the least developed countries (LDCs) live on less than US $1 a day. In 2000, this group totalled 334 million. By 2015, they could be 471 million
Such poverty levels limit their ability to generate domestic resources. In 28 LDCs, the ratio of gross capital formation to gross domestic product (GDP) rose from 20.2 per cent in 1998 to 23 per cent in 2002 and the domestic savings rate from 4.4 per cent to 4.8 per cent. The rest of the 18.2 per cent of GDP in 2002 came from external sources
|
Grants, too, are now used to provide basic services. The proportion of bilateral aid for developing productive sectors , economic infrastructure and agriculture fell by around 50 per cent over two decades from 1980 levels
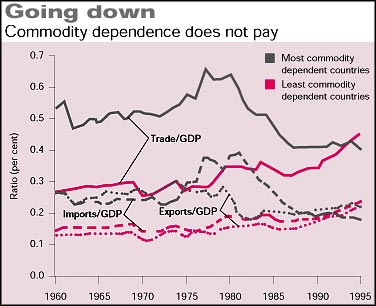
Even their last resort, export revenues, is being eroded. 67 per cent of the merchandise exports in 31 nations comprises primary commodities. From 1980 to 2003, prices of food items fell by 73.3 per cent, agri-raw materials by 60.7 per cent and minerals by 59.5 per cent
Had prices of these commodities remained at 1980 levels , the LDCs would have earned an additional US $1.2 billion. Of this, US $312 million would have accrued to the coffee exporters, US $386 million to cotton exporters and US $751 million to mineral exporters
|
|||||||||||||||||||||||||||||||||||||||||||||||||||||||||||||||||||||||||||||||||||
Source: Anon 2004, The Least Developed Countries Report 2004, United Nations Conference on Trade and Development, New York and Geneva


