

Accessing Asia: air pollution and greenhouse gas emissions indicators for road transport and electricity
Accessing Asia: air pollution and greenhouse gas emissions indicators for road transport and electricity
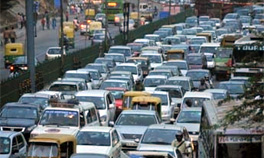
At current annual average growth rates, the number of vehicles in Asia will double in less than seven years from 2010 and India along with Indonesia, Nepal, PR China & Sri Lanka show the fastest annual average growth rates.
This report presents the first benchmark of air pollutant (PM) and greenhouse gas (CO2) emissions for 13 countries and 24 cities across Asia for road transport and electricity generation. It includes: Road transport. Total road transport emissions for Asia and individual countries and cities. The emissions intensity is expressed by population, GDP, passenger and freight movement, vehicle types and fuel types. Data are provided for underlying emission drivers, including growth in vehicle numbers, motorization index, fuel consumption, and travel activity. Electricity generation. Total electricity generation emissions for Asia and individual countries. The emissions intensity is expressed by population, GDP, end-use sector, and fuel type. Data are provided for underlying emission drivers, including electricity access, generation, consumption, and efficiency; and fuel mix. Country Profiles and City Profiles with data for emissions and underlying drivers for road transport and electricity generation. Guidelines for development, measurement and use were prepared on how to measure and use indicators for Asia, based on existing guidelines by the European Environment Agency, International Energy Agency, Intergovernmental Panel on Climate Change, and US Environmental Protection Agency.
See Also
Report: Key indicators for Asia and the Pacific 2012.
Report: World energy outlook 2012.
Report: Transport and CO2 emissions...
Report: CO2 emissions from fuel combustion.
Report: Statistical yearbook for Asia & the Pacific 2012.
Report: International fuel prices.
Report: Mitigating adverse impacts...


